Lmao at python being a dude vaping in a coffee shop
25.02.2026 20:21
👍 1
🔁 0
💬 0
📌 0
Lmao at python being a dude vaping in a coffee shop

I tried to tell y'all.
#texas fam -early voting is here!
Reach out to your network -remind them on voting
Tomorrow is my birthday and to celebrate, I will of course go vote!
@akjackson.bsky.social @libbyheeren.bsky.social @frankiethull.bsky.social @simontrose.bsky.social @jxmartinez.bsky.social @jessgraves.bsky.social
Hi Bluesky! It’s been a while!
We’re growing the Stats team at Loyal!
We’re looking for a statistician with experience in observational and late stage interventional clinical trials in human or vet med.
If that is you or anyone you know please apply!
job-boards.greenhouse.io/loyal36/jobs...
If you’re still hunting for color tools, I’m working on a more user-friendly version of meodai.github.io/poline/ keeping you huedrated

Methodology

Hooray! See y'all next year in my hometown! 🐎 #positconf #rstats #htx
🫡 yessir! Htown assemble🫡
(Thanks for tagging me, this is how I learned posit conf is coming to Houston and I’m so excited!)

Manipulated theatrical release poster of "The men who stare at goats" which now reads "the men who stare at coefficients" Top shows the profiles of George Clooney, Jeff Bridges, Ewan McGregor, Kevin Spacey and a goat. Below the text: the men who stare at coefficients with the silhouette of a man sitting in front of a computer screen, and the silhouette of a goat
You're very welcome @vincentab.bsky.social
P.S. Check out our preprint on an alternative to staring at coefficients: j-rohrer.github.io/marginal-psy...

Whoa—my book is up for pre-order!
𝐌𝐨𝐝𝐞𝐥 𝐭𝐨 𝐌𝐞𝐚𝐧𝐢𝐧𝐠: 𝐇𝐨𝐰 𝐭𝐨 𝐈𝐧𝐭𝐞𝐫𝐩𝐫𝐞𝐭 𝐒𝐭𝐚𝐭 & 𝐌𝐋 𝐌𝐨𝐝𝐞𝐥𝐬 𝐢𝐧 #Rstats 𝐚𝐧𝐝 #PyData
The book presents an ultra-simple and powerful workflow to make sense of ± any model you fit
The web version will stay free forever and my proceeds go to charity.
tinyurl.com/4fk56fc8
Damn! We are truly blessed to receive such quality, detail and rigor from you — and on a subject you’re not even that interested in!!🔥🔥
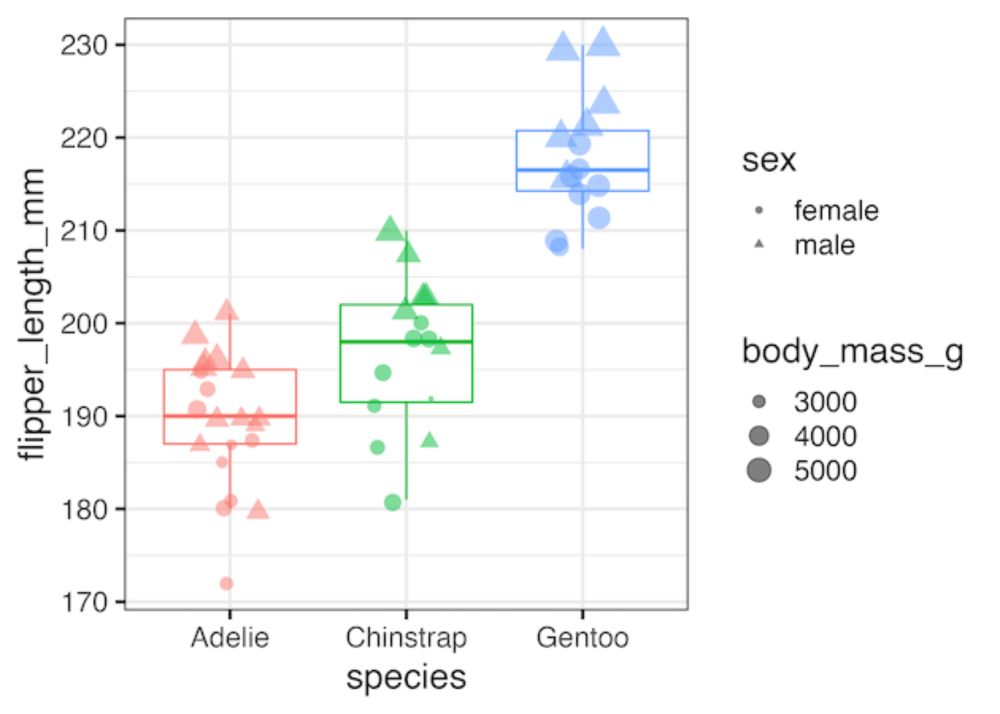
Selectively Remove or Hide Legends in ggplot2 datavizpyr.com/selectively-... #dataviz #rstats
🐸🐸🐸

Models as Prediction Machines: How to Convert Confusing Coefficients into Clear Quantities Abstract Psychological researchers usually make sense of regression models by interpreting coefficient estimates directly. This works well enough for simple linear models, but is more challenging for more complex models with, for example, categorical variables, interactions, non-linearities, and hierarchical structures. Here, we introduce an alternative approach to making sense of statistical models. The central idea is to abstract away from the mechanics of estimation, and to treat models as “counterfactual prediction machines,” which are subsequently queried to estimate quantities and conduct tests that matter substantively. This workflow is model-agnostic; it can be applied in a consistent fashion to draw causal or descriptive inference from a wide range of models. We illustrate how to implement this workflow with the marginaleffects package, which supports over 100 different classes of models in R and Python, and present two worked examples. These examples show how the workflow can be applied across designs (e.g., observational study, randomized experiment) to answer different research questions (e.g., associations, causal effects, effect heterogeneity) while facing various challenges (e.g., controlling for confounders in a flexible manner, modelling ordinal outcomes, and interpreting non-linear models).

Figure illustrating model predictions. On the X-axis the predictor, annual gross income in Euro. On the Y-axis the outcome, predicted life satisfaction. A solid line marks the curve of predictions on which individual data points are marked as model-implied outcomes at incomes of interest. Comparing two such predictions gives us a comparison. We can also fit a tangent to the line of predictions, which illustrates the slope at any given point of the curve.

A figure illustrating various ways to include age as a predictor in a model. On the x-axis age (predictor), on the y-axis the outcome (model-implied importance of friends, including confidence intervals). Illustrated are 1. age as a categorical predictor, resultings in the predictions bouncing around a lot with wide confidence intervals 2. age as a linear predictor, which forces a straight line through the data points that has a very tight confidence band and 3. age splines, which lies somewhere in between as it smoothly follows the data but has more uncertainty than the straight line.
Ever stared at a table of regression coefficients & wondered what you're doing with your life?
Very excited to share this gentle introduction to another way of making sense of statistical models (w @vincentab.bsky.social)
Preprint: doi.org/10.31234/osf...
Website: j-rohrer.github.io/marginal-psy...
📌
Oh boy was she still hungry lol!
Lil’ Muncher (official name lol) update:
1) LM abandoned his post at 50% consumption but
2) Found a friend, LM2
3) And many more 😵💫
Consumption rates have become exponential and sadly all (visible) Munch Bunchers had to be evicted.
@mackaszechno.bsky.social @econmaett.github.io LMAO
I can debug my code, but not my garden!
I do intend to let it keep on keepin’ on at least for a little while haha. So a name does seem appropriate! I’ll update according lol.
*leaf 🙃🫠
Little muncher < 24 hrs later:
1) still on the same lead (! I was surprised by this!)
2) leaf consumption at 50%
Ugh I wish I had chickenssssss 😭

Soon to become this absolute beast

Carolina Sphinx caterpillar hanging upside down on a tomato leaf
I’m supposed to hate this little cutie, because it will eat up my tomato plant but…. Come onnnnn look at it 🥹🥹🥹🥹

🚀 gratia 0.11.0 is out!
Now has a paper in JOSS — please cite 📄 doi.org/10.21105/jos...
Experimental parallel processing ⚡
New assemble() for building plots 🎨
Better support for complex families + new diagnostics 🧪
Lots of bug fixes + polish ✨
👉 gavinsimpson.github.io/gratia/
#Rstats
📌